How do I review return analytics?
Last updated: May 18, 2026
Quick answer
Use this article to open Return Analytics and review return trends by date, warehouse, return reason, or item search.
Common use cases
- Operations manager: Check whether return volume is changing before a weekly operations review.
- Warehouse lead: Compare return activity for a warehouse before investigating returned items.
- Customer support lead: Gather the return report context needed before asking Logentic about a number that looks wrong.
When to use this
- You need to find Return Analytics.
- You need to filter return analytics by date, warehouse, return reason, or item.
- You need to collect the right context before contacting Logentic about return numbers.
When not to use this
- You need to create or complete an individual return.
- You need the exact formula behind a return metric.
- You need a refund, billing, SLA, or policy decision.
At a glance
| What you are doing | What you need | Good result | Contact us if |
|---|---|---|---|
| Use this article to open Return Analytics and review return trends by date, warehouse, return reason, or item search. | Confirm you have access to Analytics and Return Analytics. Know the date range you want to review. | The page shows Return Analytics with your selected filters and a visible return chart for the period you selected. | Return analytics do not load, filters produce unexpected results, the report conflicts with visible return records, or you need the exact definition of a metric. |
Before you start
- Confirm you have access to Analytics and Return Analytics.
- Know the date range you want to review.
- Know the warehouse, return reason, or item you want to inspect if you are narrowing the report.
Steps
- Go to Analytics in the left navigation.
- Open Return Analytics.
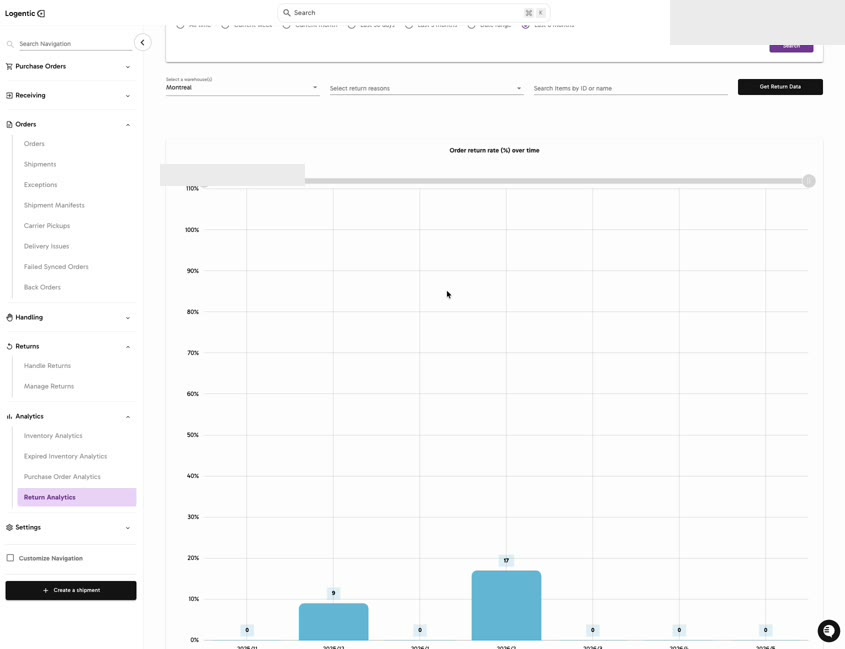
- Select a date range such as All time, Current week, Current month, Last 30 days, Last 3 months, Date range, or Last 6 months.
- Select the warehouse in Select a warehouse(s) when you need warehouse-specific data.
- Select a return reason in Select return reasons when you need reason-specific data.
- Use Search items by ID or name when you need to focus on a specific item.
- Select Search.
- Select Get Return Data to load the return analytics view.
- Review the chart and selected filters before using the data in an operations or support decision.
Screenshots
Steps 1-9: Open Return Analytics, set filters, and load the return data chart.
What good looks like
The page shows Return Analytics with your selected filters and a visible return chart for the period you selected.
Common issues and next actions
| If this happens | What to do next |
|---|---|
| The chart does not show the data you expected. | Check the date range, warehouse, return reason, and item search before treating it as a data issue. |
| You need the formula behind a metric. | Contact us. The recording verifies the page and filters, but not the calculation rules behind each metric. |
| The analytics number does not match your return records. | Compare the filter context with Manage Returns before escalating. |
Contact us when
Return analytics do not load, filters produce unexpected results, the report conflicts with visible return records, or you need the exact definition of a metric.
Contact options
- Email Logentic Support: best for detailed requests, screenshots, or follow-up context.
- Open in-app chat: fastest when you are already signed in and need help in context.
- Call Logentic: call (855) 529-0009 for an urgent launch, warehouse, or fulfillment blocker.
- Request Slack support access: ask us to add your team to a shared Logentic support channel.
Send us this information
- Screenshot of Return Analytics.
- Date range selected.
- Warehouse, return reason, and item search used.
- The number or chart that looks wrong.
- A matching return ID or order ID if one is involved.
- Expected result.
- Actual result shown in Logentic.
Related workflow
- Find or create the return.
- Review return analytics for the period and warehouse.
- Escalate only if the filtered analytics view conflicts with the return records or you need metric definitions.